installation | display | identify | convert | composite | potrace | rsvg-convert | gnuplot | montage | graphviz | ditaa | youtube-dl | ffmepg | gifsicle
This is a crash course in creating and modifying images and video at the command line.
Installation
Mac OS X with Homebrew:
$ brew install ditaa ffmpeg gifsicle gnuplot graphviz imagemagick librsvg potrace youtube-dl
Ubuntu:
$ sudo apt install ditaa ffmpeg gifsicle gnuplot graphviz imagemagick potrace youtube-dl
Display
When editing images at the command line, it is convenient to have a quick way to examine the results.
On Mac OS X use qlmanage -p:
$ qlmanage -p onepiece_crop.jpg
On a operating system where X Windows is running, use display, part of the ImageMagick tool suite:
$ display onepiece_crop.jpg
These techniques usually don't work when working on a remote server, but remember that python makes it easy to serve up all the files in a directory via http:
$ python3 -m http.server 8000
Identify
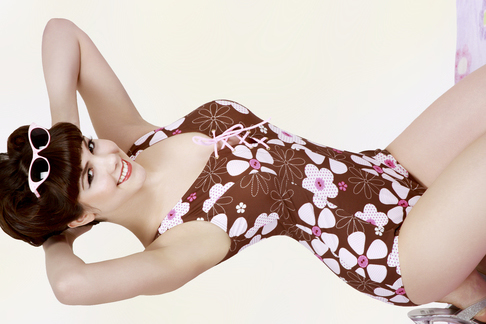
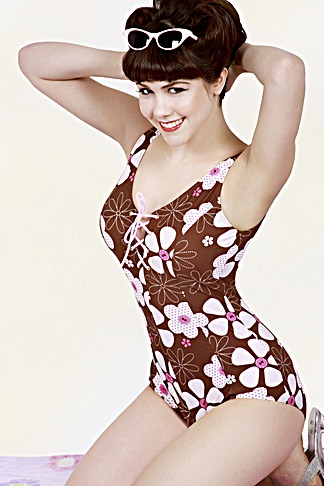
Let's start with this image:
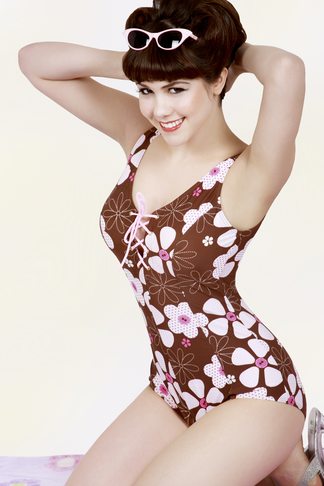
We can use identify to get the dimensions of the image:
$ identify onepiece.jpg
onepiece.jpg JPEG 324x486 324x486+0+0 8-bit sRGB 151KB 0.000u 0:00.000
Convert
convert is part of the ImageMagick suite of tools. It takes the input file and the output file as command line arguments. The output file is a copy of the input file with the specified changes applied to it. A hyphen - can be used to read from standard input or write to standard output.
The convert command recognizes over 200 option flags. The mogrify command recognizes almost all of the same flags. It behaves like convert, except that it modifies the input file.
convert can make an image smaller:
$ echo $(( 324 / 2 ))x$(( 486 / 2 ))
162x243
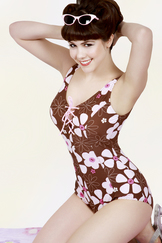
$ convert -resize 162x243 onepiece.jpg half.jpg
Actually, we don't have to compute the new dimensions:
$ convert -resize '50%' onepiece.jpg half.jpg
We can crop it:
$ convert -crop 273x294+51+0 onepiece.jpg onepiece_crop.jpg
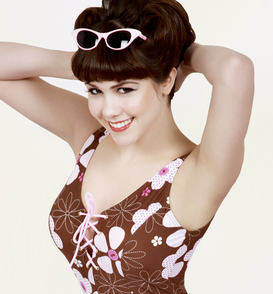
The argument to the -crop flag is WIDTHxHEIGHT+X+Y, where X andY give the location of the upper left corner of the crop region in the coordinate system whose origin is the upper left corner of the original image.
To reflect the image around the vertical center line:
$ convert -flop onepiece.jpg onepiece_flop.jpg
We can also reflect the image around the horizontal center line:
$ convert -flip onepiece.jpg onepiece_flip.jpg
We can rotate the flopped image clockwise 270°:
$ convert -rotate 270 onepiece_flop.jpg onepiece_flop_rotate270.jpg
The output format is controlled by the suffix of the file. Hence to convert a JPG to a GIF:
$ convert onepiece.jpg onepiece.gif
If the output format is JPG or PNG, you can control the compression level with the -quality flag. Give it a value between 100 (no compression) and 0 (maximum compression):
$ ls -l onepiece.jpg
-rw-r--r--@ 1 clark  staff  151209 Sep 12 18:38 onepiece.jpg

$ convert -quality 50 onepiece.jpg onepiece_low.jpg

$ ls -l onepiece_low.jpg
-rw-r--r--@ 1 clark  staff  40871 Sep 12 19:45 onepiece_low.jpg
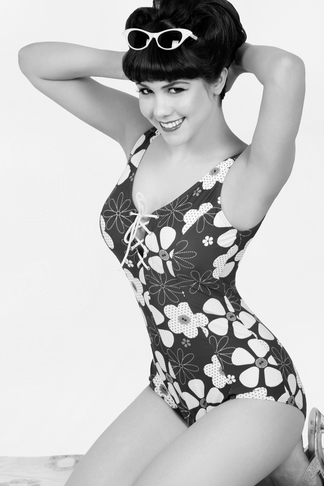
Convert to a black-and-white image:
$ convert onepiece.jpg -colorspace gray onepiece_gray.jpg
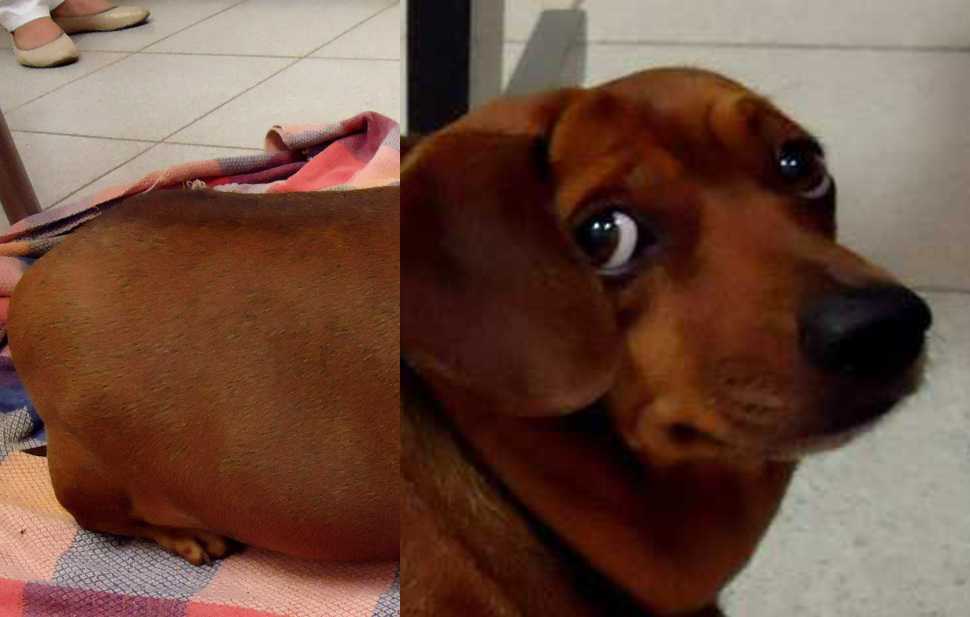
Now let's switch to this image:
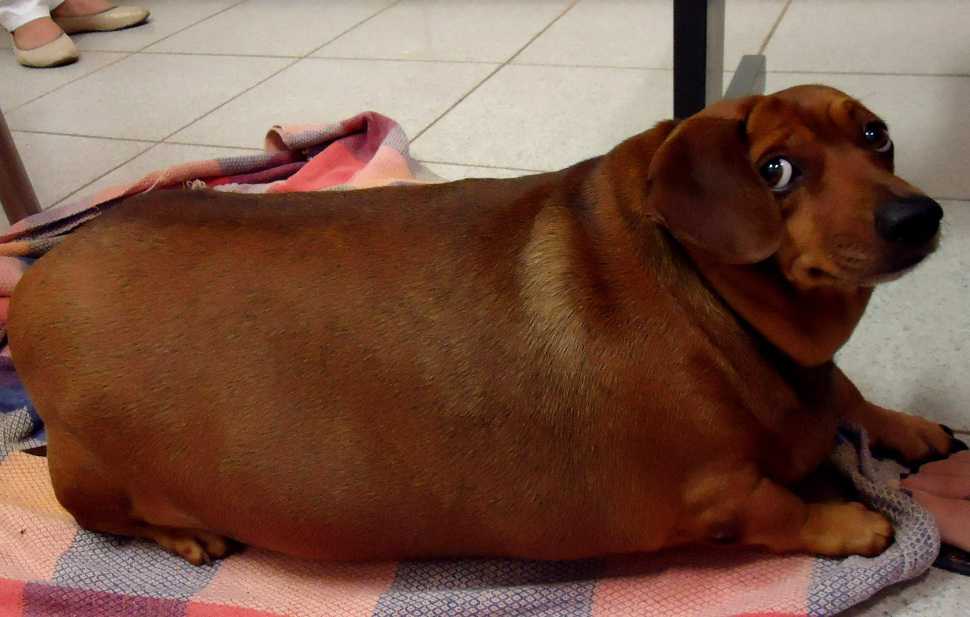
The original image of the dachshund was 195k. Before I uploaded it I used convert to reduce the size 43k. The number after the -quality flag can be set even lower for lossier compression:
$ convert -strip -quality 50 dachshund_orig.jpg dachshund.jpg
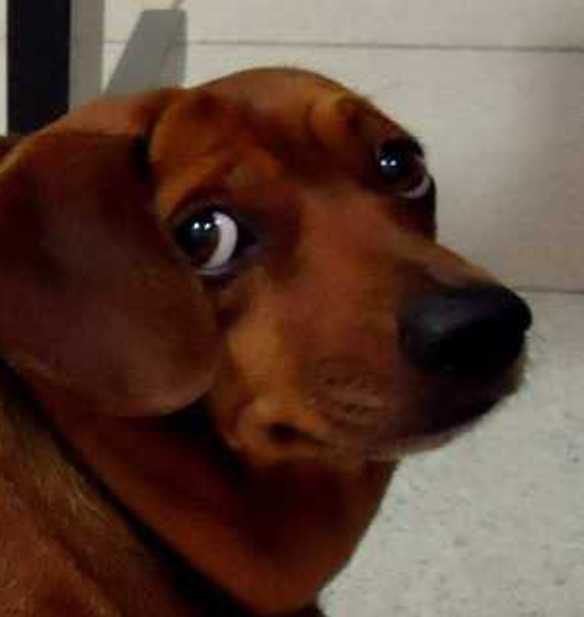
We can perform two operations at once. For example, to crop the dog's head and zoom in:
$ convert -crop 300x317+670+50 -resize 800x617 dachshund.jpg head.jpg
We can use convert to place text over an image:
$ convert head.jpg -font Arial -pointsize 72 -fill white -draw "text 80,550 'wut'" comp4.jpg

This lists the available fonts:
$ convert -list font
Draw a white rectangle, so we can make the text black:
$ convert head.jpg -fill white -draw "rectangle 60,490 210,570" \
  -font Arial -pointsize 72 -fill black -draw "text 80,550 'wut'" comp5.jpg

Here is an example of the graphics primitives available to the convert command:
$ convert -size 300x210 xc:transparent \
  -fill red -stroke red -draw "circle 150,130 150,180" \
  -fill white -stroke black -draw "rectangle 120,30 220,130" \
  -stroke green -strokewidth 3 -draw "line 50,30 200,180" \
  -fill blue -stroke blue -draw "polygon 240,30 240,110, 150,110" \
  comp6.gif
Here is an example of using Bézier curves to draw a figure:
$ convert -size 300x300 xc:transparent \
  -fill pink -stroke pink \
  -draw "path 'M143,279C145,246,8,135,8,96C10,9,134-3,138,89 \
    c0-39,22-64,46-64c33-0,70,35,70,61C255,156,140,246,143,279z'" \
  heart.png

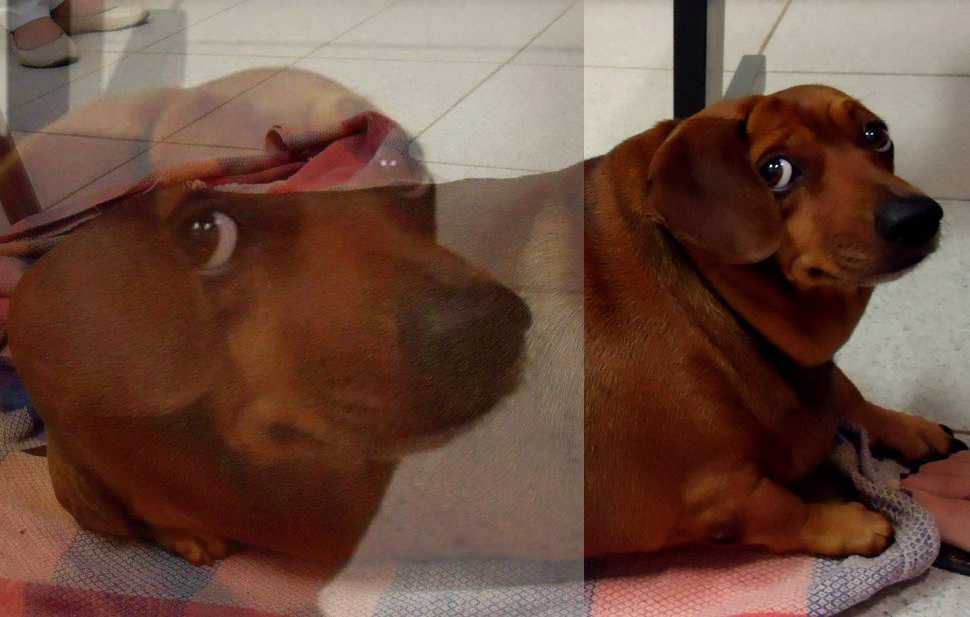
Composite
To put one image over another in the z-axis direction use composite. To put one image over another in the y-axis direction, use montage.
Place the dachshund's head on top of the original image:
$ composite head.jpg dachshund.jpg comp.jpg

We can use the -geometry flag to control the position of the head:
$ composite -geometry +400+0 head.jpg dachshund.jpg comp1.jpg
We can use convert to make the head semi-transparent. We save the new head file as a PNG, since JPG doesn't have an alpha channel.
$ convert head.jpg -alpha set -channel a -evaluate set 50% +channel semi_transparent.png
$ composite semi_transparent.png dachshund.jpg comp2.jpg
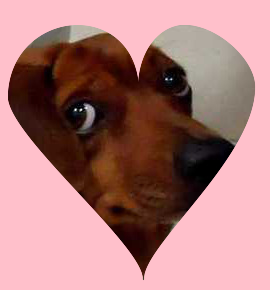
Here is a masking example. The convert -alpha Off -compose CopyOpacity command is the one doing the masking.
$ convert -crop 300x317+670+50 -resize 300x300 dachshund.jpg head2.jpg
$ convert -size 300x300 xc:white white.png
$ convert -size 300x300 xc:pink pink.png
$ composite head2.jpg -geometry -20+0 white.png head3.jpg
$ convert head3.jpg heart_mask.png -alpha Off -compose CopyOpacity -composite heart_head.png
$ composite heart_head.png pink.png comp7.png
$ convert -crop 270x290+0+0 -resize 270x290 comp7.png comp8.png
Potrace
potrace converts images to a vector graphics format.
potrace requires a bitmap input. Use convert to create a .bmp file from another format:
$ convert onepiece.jpg onepiece.bmp
Then create an SVG file:
$ potrace -b svg -k 0.65 -t 6 onepiece.bmp

$ ls
onepiece.bmp
onepiece.jpg
onepiece.svg
The -k flag controls how dark an input pixel must be to be classified as black. It can be anywhere between 0.00 and 1.00, with the default value at 0.50. With 0.65, the value we have chosen, more input pixels are classified as black.
The -t flag suppresses elements that derive from a small number—in this case 6—of input pixels.

The --color '#ff0000' flag would change the color from black to red. The "white" parts of the image are actually transparent. Non-black areas which are surrounded by black areas can have their color set using the --fillcolor flag.
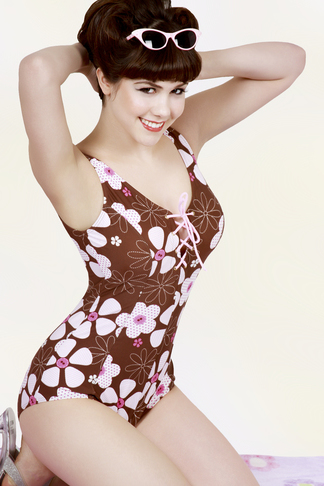
Sharpening the image with convert can help preserve outlines:
$ convert -sharpen 0x2 onepiece.jpg onepiece_sharp.jpg
$ convert onepiece_sharp.jpg oncepiece_sharp.bmp
$ potrace -b svg -k 0.65 -t 6 onepiece_sharp.bmp
Here is the sharpened jpg, and the resulting svg in which we have preserved an outline of the subject's arms:

Rsvg-convert
To convert an svg back to a pixel format:
$ rsvg-convert onepiece_sharp.svg > onepiece_sharp.png
Gnuplot
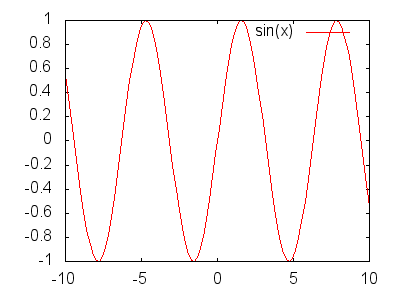
gnuplot is an interactive program which can be used to plot a function:
$ gnuplot
> set terminal png size 400,300
> set output "sin.png"
> plot sin(x)
> quit
gnuplot can be used in a noninteractive way with the -e flag. Separate statements with semicolons:
$ gnuplot -e 'set terminal png size 400,300; set output "sin.png"; plot sin(x)'
It is also possible to put statements in a file and run them like a script. Note the technique for passing in an argument on the command line:
$ cat sin.gnuplot
set terminal png size 400,300
set output path
plot sin(x)

$ gnuplot -e "path='sin.png'" sin.gnuplot
It is possible to replace the "sin(x)" in the legend with a different string, or to remove the legend entirely:
> plot sin(x) title "sine function"

> plot sin(x) notitle
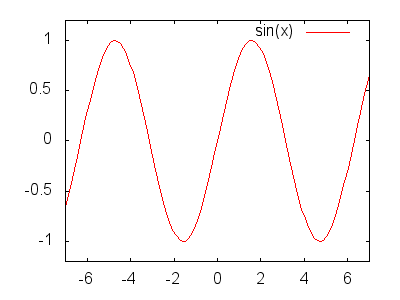
It is possible to set the lengths of the x and y axes:
$ gnuplot
> set terminal png size 400,300
> set output "sin_range.png"
> plot [-7.0:7.0] [-1.2:1.2] sin(x)
> quit
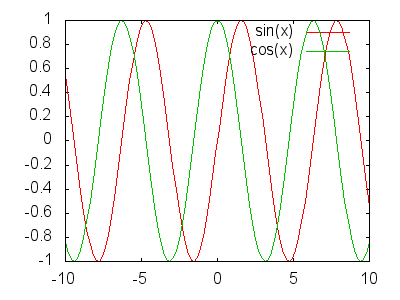
Multiple functions can be plotted:
$ gnuplot
> set terminal png size 400,300
> set output "superimpose.png"
> plot sin(x),cos(x)
> quit
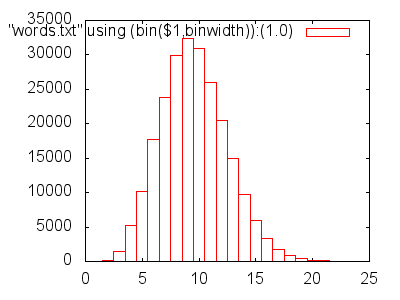
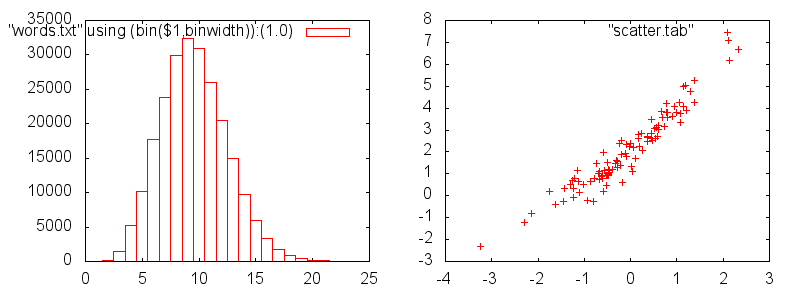
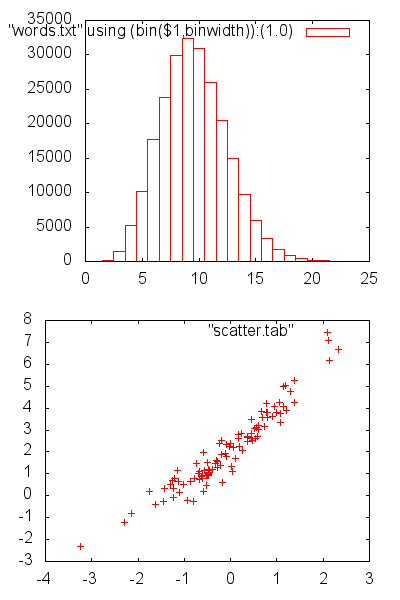
gnuplot can be used to plot data. A histogram is a good way to summarize univariate data. This example shows the number of words by word length in a dictionary:
$ awk '{ print length($0)}' /usr/share/dict/words > words.txt

$ gnuplot
> set terminal png size 400,300
> set output "words.png"
> binwidth=1
> bin(x,width)=width*floor(x/width)
> plot "words.txt" using (bin($1,binwidth)):(1.0) smooth freq with boxes
> quit
The most general way to plot bivariate data is with a scatterplot.
$ gnuplot
> set terminal png size 400,300
> set output "scatter.png"
> plot "scatter.tab" with points
> quit
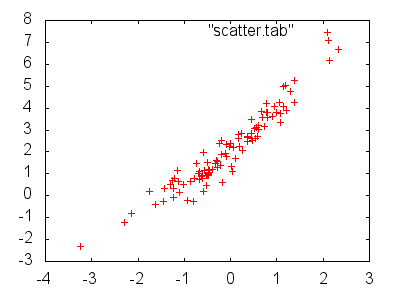
The file scatter.tab is just generated data.
When reading a file of data, gnuplot ignores lines that start with #. It expects the columns to be whitespace delimited. If there are more than two columns of data, a using X:Y clause can be added to the plot statement to specify the number of x column and the y column.
The man page for gnuplot is brief, but the online documentation is extensive. Use the help command to see general documentation, or help FUNC to see documentation on a specifics function:
$ gnuplot
> help
> help plot
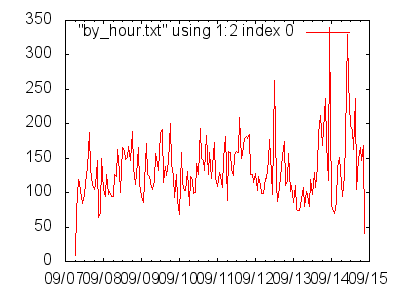
If there is a functional relationship in the data, such as time series data, then a line graph is appropriate.
For this example we are using a web server access log. The entries are one per line and look like this:
74.87.40.82 - - [07/Sep/2014:06:55:23 +0000] "GET /numerical-analysis HTTP/1.1" 200 71155 "-" "Mozilla/5.0 (Windows NT 6.1; WOW64) AppleWebKit/537.36 (KHTML, like Gecko) Chrome/36.0.1985.143 Safari/537.36"
74.87.40.82 - - [07/Sep/2014:06:55:24 +0000] "GET /favicon.gif HTTP/1.1" 304 0 "-" "Mozilla/5.0 (Windows NT 6.1; WOW64) AppleWebKit/537.36 (KHTML, like Gecko) Chrome/36.0.1985.143 Safari/537.36"
We pull out the timestamps and count the number per hour:
$ awk '{print substr($4, 2, 14)}' access.log > hours.txt

$ awk '{cnt[$1] +=1 } END {for (i in cnt) print i, cnt[i]}' < hours.txt | sort > by_hour.txt
Here is the result: by_hour.txt
Then we plot it:
$ gnuplot
> set terminal png size 400,300
> set output "by_hour.png"
> set xdata time
> set timefmt "%d/%b/%Y:%H"
> plot "by_hour.txt" using 1:2 with lines
> quit
The set timefmt command uses the same notation as strftime from the C standard library.
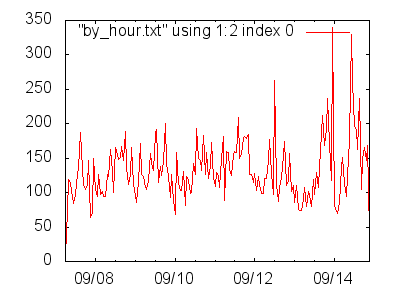
The dates on the x-axis are crowded and hard to read. We can fix it by adding these two statements to the gnuplot session before we call plot.
> set format x '%m/%d'
> set xtics '08/Sep/2014:00', 2 * 24 * 60 * 60, '14/Sep/2014:00'
The set format x sets the format of the tics on the x-axis. The set xtics command controls where they occur. The first and last timestamp must be specified in the format of the set timefmt command. The middle argument is the distance between tics in seconds.
Montage
montage is part of the ImageMagick tool suite. Use it to paste multiple images together into a single image:
montage -geometry +0+0 words.png scatter.png montage.png
To stack the images on top of each other, use the -tile option to control the number of input images per row:
$ montage -tile 1x -geometry +0+0 words.png scatter.png stack.png
Also convert foo.png bar.png +append for left-to-right.
And convert foo.png bar.png -append for top-to-bottom.
Graphviz
dot is part of the Graphviz suite of tools.
dot takes as input files which contain the DOT graph description language.
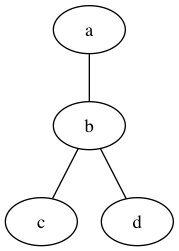
Here is an undirected graph:
graph {
     a -- b -- c;
     b -- d;
 }
Here is how to run dot:
$ dot -Tpng < /tmp/graph.dot > /tmp/graph.png
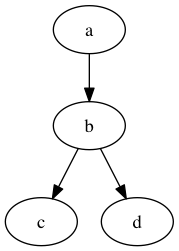
This is a directed graph:
digraph {
     a -> b -> c;
     b -> d;
 }
How to set attributes of the vertices and edges:
 graph {
     a [label="Foo"];
     b [shape=box];
     a -- b -- c [color=blue];
     b -- d [style=dotted];
 }
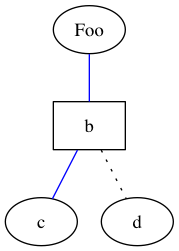
There are more atttributes which can be used to customize individual nodes and edges or the whole graph. See man dot.
Some of the other command line tools you get when installing Graphviz:
- circo
- fdp
- neato
- patchwork
- sfdp
- twopi
The commands work on the same input files; they use different strategies for arranging the nodes.
dot works well when the graph is a hierarchy or DAG. The algorithm is possibly described here.
The nodes are sorted by the upper limit on the number of parents. Nodes without any parents are root nodes and appear at the top of the page.
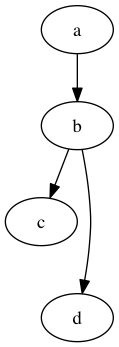
An example of using an invisible edge to push a node down a rank:
digraph {
     a -> b -> c;
     b -> d;

     c -> d [style=invis];
 }
Using rankdir to change the orientation of the graph:
digraph {
     rankdir=LR;
     a -> b -> c;
     b -> d;
 }
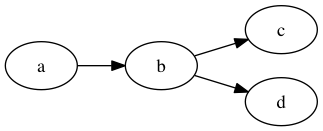
Other possible rankdir values are RL and BT. rankdir can be set from the command line:
$ dot -Tpng -Grankdir=LR < foo.dot > foo.png
Ditaa
ditaa can convert ASCII art into a diagram:
$ cat diagram.txt
  +-------------------+          +---------------------+
  |                   |          |                     |
  |                   |          |                     |
  |    The Source     |--------->|     The Target      |
  |                   |          |                     |
  |                   |          |                     |
  +-------------------+          +---------------------+

$ ditaa --no-shadows diagram.txt diagram.png

In Emacs, use M-x picture-mode to edit ASCII art.
ditaa also interprets these characters:
| line notation | |
|---|---|
| * | small circle |
| : | turn line to dashes |
| = | turn line to dashes |
| \ | round corner |
| / | round corner |
| box notation | |
| cFFF | hex code for color |
| {d} | document (ragged bottom) |
| {s} | storage (cylinder) |
| {io} | I/O (parallelogram) |
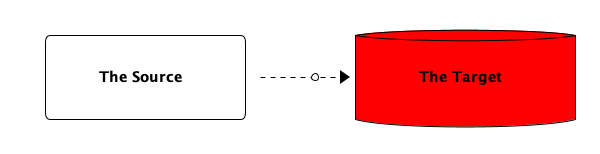
For example:
  /-------------------\          +---------------------+
  |                   |          | cF00 {s}            |
  |                   |          |                     |
  |    The Source     |-=----*-->|     The Target      |
  |                   |          |                     |
  |                   |          |                     |
  \-------------------/          +---------------------+
Youtube-dl
Download the above Youtube clip as an mp4 and play it on a Mac:
$ youtube-dl -v -f 'bestvideo[ext=mp4]+bestaudio[ext=m4a]' -o clip 'https://www.youtube.com/watch?v=14E69vVDOCA'

$ qlmanage -p clip.mp4
The -v flag shows among other things the output of the external commands used by youtube-dl. Which can be useful if the external-dependency-laden process that is downloading and converting video should fail.
If the -f flag is omitted, youtube-dl will download this clip as an .mkv file, which QuickTime Player cannot play. Other video players could be installed that play .mkv files though.
If the -o flag is not used, youtube-dl names the file after the title of the Youtube clip, which will likely have spaces in it.
Ffmpeg
Extract from the .mp4 clip we downloaded the audio as an .mp3 and play it on a Mac:
$ ffmpeg -i clip.mp4 clip.mp3

$ qlmanage -p clip.mp3
Now let's download this clip:
$ youtube-dl -v -f 'bestvideo[ext=mp4]+bestaudio[ext=m4a]' -o clip2 'https://www.youtube.com/watch?v=vIYsL8C-va8'

$ qlamange -p clip2.mp4
Get information about a video such as duration in seconds and width and height of the frames in pixels:
$ ffprobe clip2.mp4
We can cut the clip by using the -ss flag to specify a starting timestamp and the -t flag to specify a duration. We also use the -vf flag, which must appear between in the input file and the output file, to reduce the scale of the video:
$ ffmpeg -ss 00:00:07.50 -t 00:00:05.48 -i clip2.mp4 -vf scale=320:180 clip3.mp4
Dump frames from the clip at a rate of 25 per second and assemble them into an animated gif which loops:
$ ffmpeg -i clip3.mp4 %3d_clip3.jpg
$ convert -loop 0 *_clip3.jpg clip3.gif
Gifsicle
The gif is large and it runs slowly. Here is another try using gifsicle. If the speed isn't right, try adjusting the delay value.
$ ffmpeg -i clip3.mp4 -pix_fmt rgb24 -r 10 -f gif - | gifsicle --optimize=3 --delay=7 > clip3.gif

TODO
This will splice videos that are the same codec together, but for mpegs at least, there are artifacts at the joins:
$ cat list.txt
file 'first.mpg'
file 'second.mpg'
file 'third.mpg'

$ ffmpeg -f concat -i list.txt -c copy output.mpg
Supposing the original dimensions are 352x240. This crops a half-sized, centered video:
$ ffmpeg -i foo.mpg -filter:v "crop=176:120:88:60" crop_foo.mpg